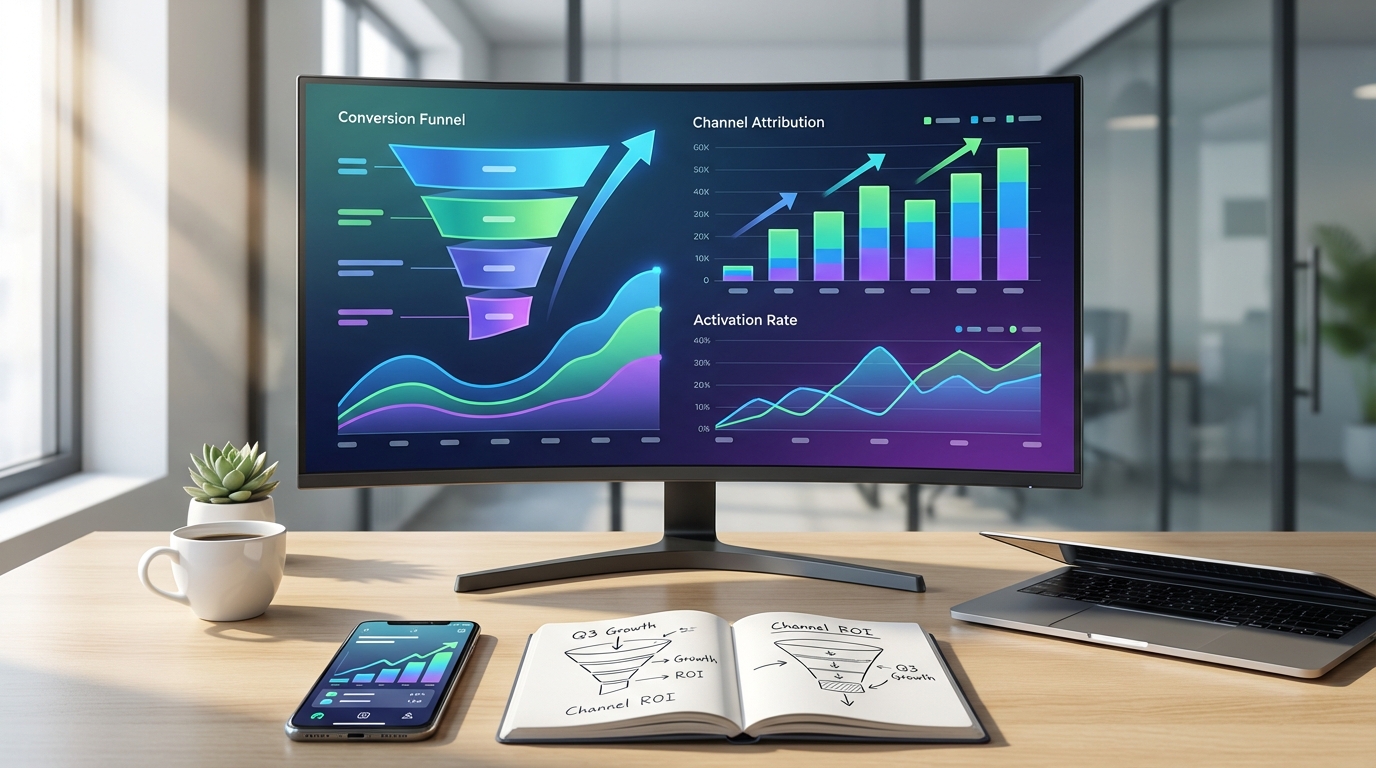
Track Marketing Channels to Activated Users in 2026
Most SaaS teams can tell you where signups come from. Google Ads, LinkedIn campaigns, organic search, referrals—the list goes on. But here's the problem: signups don't pay the bills. Activated users do.
You need to know which channels drive users who actually experience value, complete onboarding, and stick around long enough to become customers. Not which channels just fill your CRM with vanity metrics.
According to a 2026 Directive study, top-quartile B2B SaaS products achieve 40%+ activation rates and target 50%+ for self-serve models—but most marketing teams can't even tell you which campaigns drive those activations. That gap between acquisition and activation is costing you revenue, wasted ad spend, and misaligned growth decisions.
This guide shows you how to track which marketing channels actually lead to activated users, measure the quality of each source, and optimize spend based on outcomes that matter.
Why signups aren't enough
A signup is a single form submission. It doesn't tell you if the user logged in again, completed setup, invited teammates, created their first project, or hit any milestone that signals real engagement.
PayPro Global reports that a healthy SaaS activation rate typically ranges from 25% to 30%. That means 70-75% of your signups never activate. They signed up, looked around, and left. If you're optimizing campaigns to drive more signups without knowing which ones activate, you're burning budget on users who'll never convert.
Activation is the moment a user reaches the "Aha!" experience—when your product delivers its core value. For Slack, it's sending 2,000 team messages. For Dropbox, it's uploading and sharing a file. For a project management tool, it might be creating a first task or inviting a collaborator.
A Reddit post from a SaaS founder in early 2026 captured the frustration perfectly: "Got 97 signups this month, as it is, I have no idea how many actually activated or which channels brought quality users versus tire-kickers." That's not a data problem. It's a tracking problem.
Signup-focused attribution tells you what's working at the top of the funnel. Activation-focused attribution tells you what's working for the business.
Define your activation event first
Before you track anything, you need to define what "activated" means for your product.
This isn't a vanity metric like "user logged in" or "clicked around for two minutes." It's the specific behavior that correlates with retention and revenue. Users who complete this action are significantly more likely to become paying customers.
According to a 2026 case study shared on Reddit, one B2B SaaS company found that users who completed three specific actions had a 62% trial-to-paid conversion rate, while users who completed zero of those actions converted at just 3%. That's a 20x difference driven by a clear, measurable activation definition.
Here's how to identify yours:
Work backward from retention. Look at users who are still active after 30, 60, or 90 days. What did they do in their first session or first week that non-retained users didn't?
Interview your best customers. Ask them to describe the moment they realized your product would solve their problem. That's your Aha! moment.
Analyze cohorts by behavior. Use product analytics to segment users by key actions (e.g., uploaded a file, connected an integration, invited a teammate) and compare conversion and retention rates.
Your activation event should be:
Specific and measurable: "User completed onboarding checklist" beats "user engaged with product."
Achievable in the first session or first few days: If it takes three weeks to activate, your funnel is broken.
Predictive of long-term value: Activated users should have dramatically higher LTV than non-activated users.
Once you've defined this event, everything else—tracking, attribution, optimization—becomes measurably easier.
The tools you'll need
Tracking marketing channels to activation requires three layers of tooling working together: attribution (where users come from), product analytics (what they do), and revenue systems (what they're worth).
Product analytics platforms
These tools track in-app behavior and let you build activation funnels that show the path from signup to value realization.
Mixpanel uses intentional event-based tracking. You define the events you care about ("User Signed Up," "Completed Setup," "Invited Teammate") and instrument them in your app. Mixpanel's funnel reports let you see conversion rates at each step and filter by acquisition source. A 2026 Reddit thread on analytics tools noted that Mixpanel is the default choice for mid-size teams tracking activation and core product loops.
Amplitude excels at behavioral cohort analysis and uses AI-driven insights to surface patterns in user journeys. You can build funnels, measure time-to-activation by channel, and use predictive analytics to identify high-intent users early. Amplitude's Marketing Analytics SDK can capture UTM parameters and tie them directly to product events.
Heap offers autocapture, meaning it tracks every user interaction automatically without requiring upfront event instrumentation. You can define activation events retroactively and immediately see historical data. This makes Heap especially useful if you're still figuring out what activation looks like or if your engineering resources are limited.
All three platforms support user properties, so you can tag each user with their acquisition source (e.g., utm_source=linkedin) and slice activation rates by channel.
Attribution and marketing analytics
These tools connect ad clicks, content touches, and campaign interactions to downstream outcomes like signups and activations.
Google Analytics 4 tracks website behavior and can push conversion events (including custom activations) back to Google Ads for optimization. GA4's funnel exploration reports let you measure drop-off from landing page to signup to activation, segmented by source/medium.
Segment acts as a customer data platform (CDP) that collects events from your website and app, then routes them to product analytics, CRM, and ad platforms. Using Segment, you can capture a user's UTM parameters at first touch, store them as user traits, and pass them along to every downstream tool. This ensures consistent attribution across your stack.
Spectacle is built specifically to solve the activation attribution problem for B2B SaaS and subscription businesses. It connects website traffic and ad performance to CRM pipeline stages, revenue outcomes, and in-product behavior. Spectacle tracks full company journeys—merging touchpoints across multiple individuals at the same account—and provides activation funnels that show which channels, campaigns, keywords, and ads drive users from first click to product engagement to paying customer. It supports both product-led (self-serve) and sales-led (demo-to-CRM) motions, and integrations with tools like HubSpot, Pipedrive, Stripe, Google Ads, and LinkedIn mean setup takes minutes, not weeks.
CRM and revenue systems
To calculate true ROI, you need to connect activation back to revenue.
HubSpot, Pipedrive, Salesforce: These CRMs store deal and revenue data. By syncing product activation events into the CRM (via Segment, Zapier, or native integrations), you can report on metrics like "deals influenced by activated users" or "average LTV by acquisition channel."
Stripe, Chargebee: Revenue platforms that track subscriptions, MRR, and customer lifetime value. When integrated with attribution tools, they allow you to calculate cost per activated customer and payback period by channel.
How to set up activation tracking
Once your tools are in place, here's the step-by-step process to connect marketing channels to activated users.
Step 1: Tag all inbound links with UTM parameters
UTM parameters are query strings appended to URLs that tell analytics tools where traffic came from. The five core parameters are:
utm_source: The referrer (e.g., google, linkedin, newsletter)utm_medium: The channel type (e.g., cpc, social, email)utm_campaign: The specific campaign (e.g., product_launch_q1)utm_content: The creative or placement (e.g., headline_a, sidebar_banner)utm_term: The keyword (for paid search)
Every external link—ads, emails, social posts, guest articles—should be tagged consistently. Use a tool like Google's Campaign URL Builder or maintain a naming convention spreadsheet to avoid data fragmentation (e.g., "Facebook" vs "facebook" vs "fb").
Step 2: Capture UTM data at signup
When a user lands on your site, store their UTM parameters in a cookie, local storage, or as hidden form fields. When they sign up, pass those parameters to your product analytics tool and CRM as user properties.
For example, in Segment:
analytics.identify(userId, {
  email: user.email,
  utm_source: getUtmSource(),
  utm_campaign: getUtmCampaign()
});
This ensures every user has attribution metadata attached from day one.
Step 3: Track activation as a distinct event
In your product analytics platform, define and instrument your activation event. In Mixpanel:
mixpanel.track("User Activated", {
  activation_type: "completed_setup",
  time_to_activation_days: 2
});
In Amplitude, send the same event with relevant properties. Make sure the user's UTM data is included as user properties so you can filter activation reports by source.
Step 4: Build activation funnels by channel
Create funnel reports that show:
Landing page visit
Signup completed
Activation event completed
Segment the funnel by utm_source, utm_medium, or utm_campaign. This reveals which channels have the highest activation rates and shortest time-to-activation.
For example, you might discover:
Google Ads (brand keywords): 35% activation rate, 1.2 days to activate
LinkedIn Ads (cold prospecting): 18% activation rate, 4.5 days to activate
Organic search: 42% activation rate, 1.8 days to activate
Now you know organic search and branded paid search drive the highest-quality users. LinkedIn Ads need better targeting or post-signup nurture.
Step 5: Sync activation data back to ad platforms
Most ad platforms (Google Ads, Meta, LinkedIn) let you send conversion events back for campaign optimization. Instead of optimizing for signups, configure your conversions to fire when a user activates.
In Google Ads, you can import conversion goals from GA4 or use the Google Ads API to send custom events. In Meta, use the Conversions API to push server-side activation events. This shifts your campaigns from optimizing for volume to optimizing for quality.
Step 6: Connect activation to revenue
Finally, tie activated users to revenue outcomes in your CRM or revenue platform. Calculate:
Activated users per channel: How many users from each source reached activation?
Conversion rate (activation to paid): What percentage of activated users became paying customers?
LTV by channel: What's the average customer lifetime value for users acquired through each channel?
CAC by activated user: Divide total ad spend by activated users (not signups) to get true cost per quality user.
This is where tools like Spectacle shine. By connecting ad spend, product behavior, CRM deals, and revenue in one view, you can report on metrics like "cost per activated user" and "revenue attributed to LinkedIn campaign X" without duct-taping five tools together.
Common mistakes to avoid
Even with the right tools, tracking activation by channel can go sideways. Here are the pitfalls we see most often:
Defining activation too early or too late. If your activation event is "user clicked one button," it's too shallow and won't correlate with retention. If it's "user spent $500," it's too late—that's conversion, not activation. Activation should happen within the first session or first few days and predict long-term engagement.
Ignoring time-to-activation. Two channels might have the same activation rate, but if one takes seven days and the other takes one day, the faster channel is more valuable. Users who activate quickly are less likely to churn before conversion.
Not accounting for multi-touch journeys. A user might discover you via organic search, return through a LinkedIn ad, and sign up after clicking an email. First-touch attribution gives all credit to organic; last-touch gives it to email. For B2B SaaS with long sales cycles, you need multi-touch or data-driven attribution models that distribute credit across the journey.
Tracking signups but not activation in ad platforms. If your Google Ads campaigns optimize for signups, the algorithm will find you users who sign up easily—not users who activate. Always configure conversion tracking to prioritize activation or trial-to-paid events.
Fragmented data across tools. If your product analytics, CRM, and ad platforms don't share a consistent user ID or attribution source, you'll never get a clean view of channel performance. Use a CDP like Segment or an integrated attribution platform to unify your data.
Measuring success: the metrics that matter
Once you've got activation tracking in place, here are the KPIs to monitor:
Activation rate by channel: (Activated users / Total signups from that channel) × 100. According to 2026 benchmarks, 25-30% is typical for B2B SaaS; 40%+ is top-quartile.
Time-to-activation by channel: Days or hours from signup to activation event. Faster is better—it signals product-market fit and reduces early churn risk.
Cost per activated user (CPAU): Total ad spend / Activated users. This is a more honest acquisition cost than cost per signup.
Activation-to-paid conversion rate: (Paid customers / Activated users) × 100. Strong activation should drive 50-70% conversion in enterprise SaaS, 20-40% in self-serve models.
LTV:CAC ratio by channel: Compare customer lifetime value to customer acquisition cost for each source. A healthy ratio is 3:1 or higher; anything below 1:1 means you're losing money.
Revenue per activated user: Total revenue / Activated users from that channel. Some channels might have lower activation rates but higher revenue per user—optimize accordingly.
Track these metrics weekly or monthly and use them to reallocate budget, pause underperforming campaigns, and double down on channels that drive real business outcomes.
What to do with the data
Knowing which channels drive activated users is only useful if you act on it.
Reallocate budget. Shift spend from high-signup, low-activation channels to high-activation channels. If LinkedIn Ads have a 15% activation rate and organic content has 40%, invest more in SEO and content distribution.
Refine targeting. If a channel has low activation, test tighter audience segments, different messaging, or alternative landing pages. Sometimes the channel isn't the problem—your targeting is.
Improve onboarding by cohort. If users from paid social take twice as long to activate as users from organic search, build channel-specific onboarding flows or email sequences to accelerate time-to-value.
Feed insights back to sales and product. Share activation data with your sales team so they can prioritize leads from high-activation channels. Share it with product so they can optimize the features and flows that drive activation.
Test new channels strategically. Use activation rate—not signup volume—as the success metric when testing new acquisition channels. A channel that drives 50 signups and 5 activations is worse than one that drives 20 signups and 10 activations.
Tracking marketing channels to activated users gives you the clarity to run a profitable, data-driven growth motion. Stop optimizing for signups. Start optimizing for users who stick around, experience value, and become customers.