
Getting Started

October 24, 2026
Funnel.io Flexpoints pricing explained: costs, examples, and flat-rate alternatives
Vincent Gaemers
On this page
Key takeaways
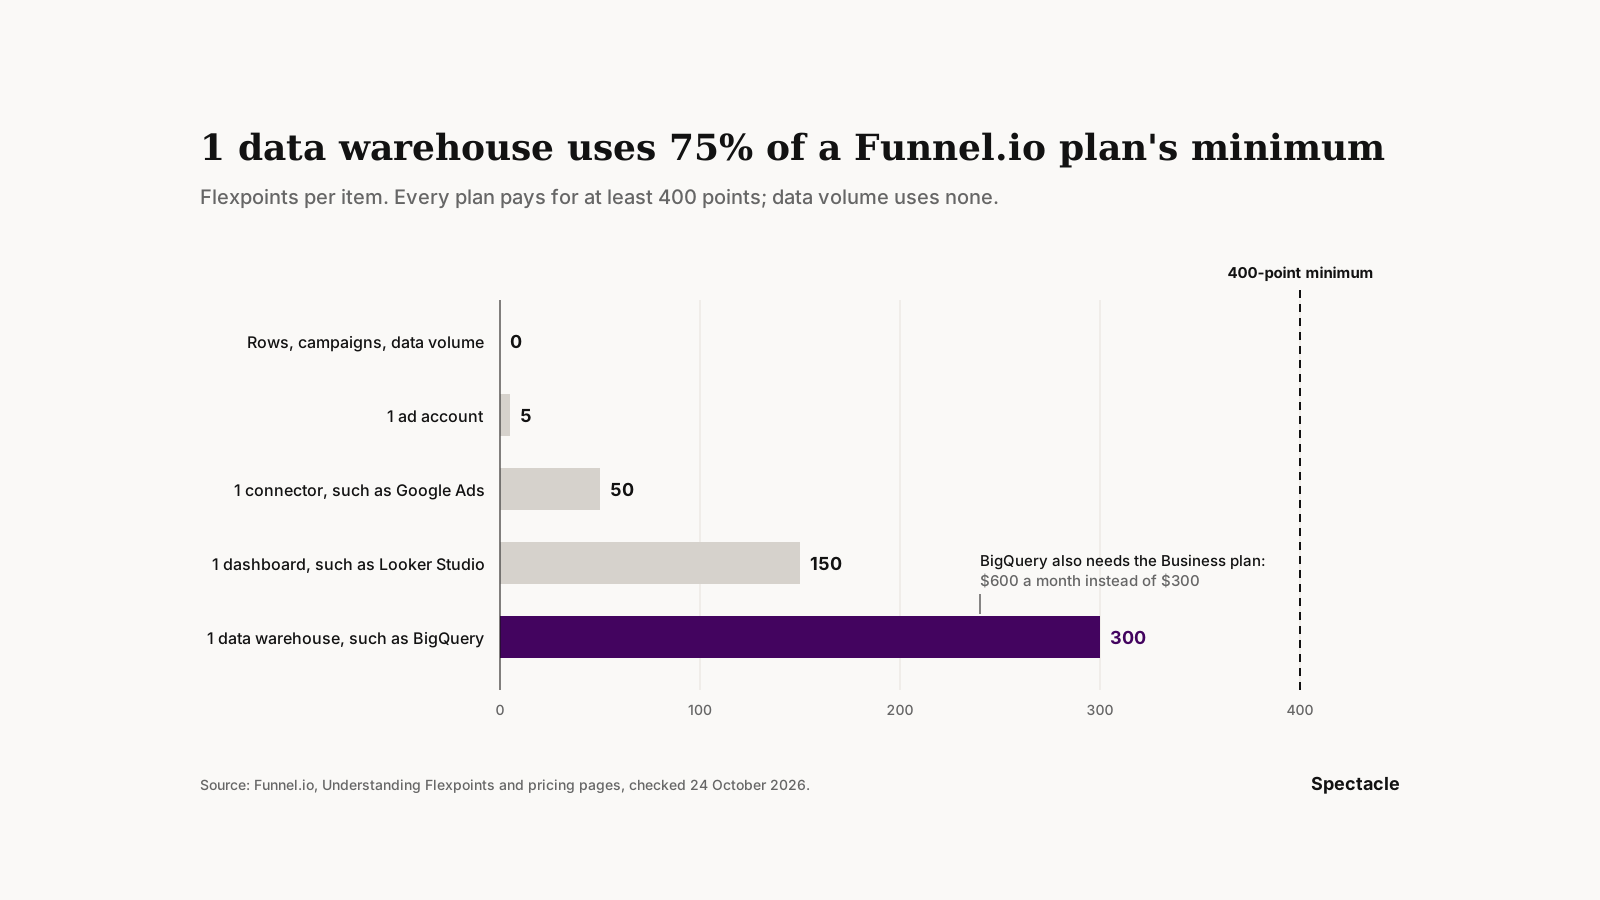
- Funnel.io bills in Flexpoints: 50 per connector, 5 per ad account, 150 per visualization destination, and 300 per data warehouse, bought in bundles of 100 with a 400-point minimum.
- Data volume costs 0 points. A stack that stands still keeps the same bill, and Funnel.io shows the cost of a change before you commit.
- Structure moves the bill. In our illustrative year, 5 ordinary changes take the stack from 315 points to 890 and capacity from 4 bundles to 9. The plan moves from Starter (from $300 a month) to Business (from $600).
- That makes Flexpoints easier to forecast than Fivetran's monthly active rows or Segment's tracked users. They are harder to forecast than Supermetrics' plans at $44 to $177 a month billed yearly, because Funnel.io doesn't publish the price of an extra bundle.
- A data hub collects what each platform claims, and those claims overlap. Spectacle ties every touchpoint to the CRM deal from €349 a month, set up in about 30 minutes.
What is Funnel.io, and what do Flexpoints pay for?
Funnel.io is a marketing data hub: it collects data from ad platforms, analytics tools, CRMs, and shops, maps it into 1 model, and sends it to dashboards, spreadsheets, BI tools, and data warehouses. Funnel, founded in 2014, calls itself a marketing intelligence platform for marketing and data teams (Funnel).
For a performance marketing team, the pipeline has 4 parts (pricing page):
- Collect. 117 connectors on Starter and more than 500 on Business. HubSpot is on every plan; Salesforce starts on Business. Funnel.io charges nothing for rows or data volume.
- Transform. Custom dimensions combine data across sources, custom metrics build ROAS or cost after VAT, rules add a margin or agency fee per campaign, and Funnel.io also converts currencies (help center).
- Store and send. Storage is included. Starter sends daily to 13 destinations, Looker Studio and Google Sheets among them. Business sends to 46, adds Power BI, Tableau, BigQuery, Amazon S3, and Azure, and exports every 2 hours. Snowflake is Enterprise only.
- Measure, as an add-on. Funnel Measure adds marketing mix modeling, a data-driven multi-touch model, and incrementality testing on Business and Enterprise, priced by ad spend or on request.
Flexpoints pay for steps 1 and 3: the connectors and accounts you collect from, and the destinations you send to.
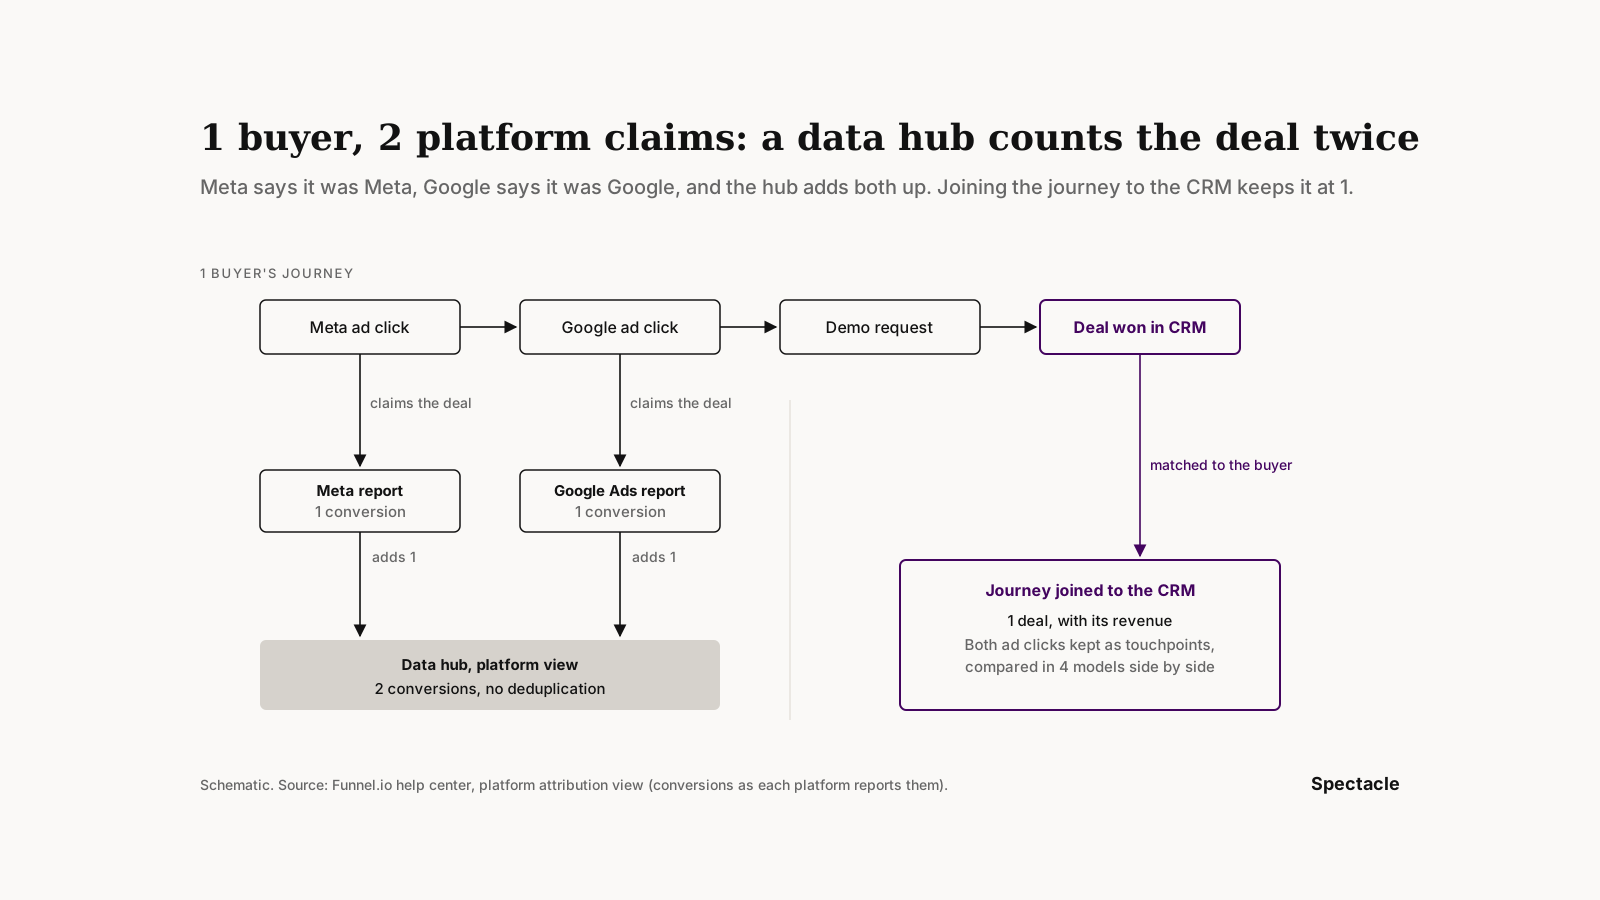
The hub works with what each tool reports. HubSpot deals and Salesforce opportunities arrive as 1 more source next to the ad data. The hub doesn't follow 1 buyer from the first click to the signed deal. That join is a warehouse project for your data team, or a job for a tool that tracks the journey itself. Funnel Measure's data-driven model scores tracked clicks and site visits, and its help article doesn't mention CRM data.
Why the pricing question changed in 2026
On 4 February 2026 Funnel.io moved new plans to a new Flexpoints model. Data sources became free, and every platform account now costs 5 points. Teams on older plans move over when they change plan at renewal, so 2 teams with the same stack can see different counts (help center).
How does Funnel.io Flexpoints pricing work?
A Flexpoint is Funnel.io's unit of subscription capacity. Your plan sets the features; the Flexpoints you buy set how many connectors, accounts, and destinations can run at the same time. Every plan starts at 400 points, and extra capacity comes in bundles of 100 (help center, updated 11 September 2026).
| What you add | Flexpoints | On plans from before 4 February 2026 |
|---|---|---|
| Connector, such as Google Ads | 50 | 50 |
| Custom connector | 50 | 100 |
| Platform account, such as 1 ad account | 5 | 0 |
| Data source, a report set up on an account | 0 | 5 |
| Visualization destination or dashboard, such as Looker Studio | 150 | 150 |
| Data warehouse destination, such as BigQuery | 300 | 300 |
| Conversion upload to an ad platform | 50 | 50 |
| Platform account in a conversion upload | 5 | 0 |
| Google Sheets workbook | 10 | Per tab |
Data sources, Google Sheets tabs, and dashboards built on the Insights page cost nothing. Google Sheets is also a destination: the help center's example charges 50 points for it plus 10 per workbook, while the pricing page lists it with the 150-point visualization destinations. 5 rules turn that table into a bill:
- 400-point minimum. Every plan pays for at least 400 points, so a stack of 260 costs the same as a stack of 400.
- Bundles of 100. Above 400 you buy capacity in steps of 100. The price per bundle varies by plan and isn't on the pricing page. Plans start from $300 a month (Starter) and $600 a month (Business), billed annually; Enterprise is quoted.
- Paused items don't count. A connector or export counts while at least 1 data source on its accounts is Active, Active with error, or set to Don't use in Funnel. Pausing or deleting all data sources on an account, or pausing an export, frees the points.
- Data volume is free. Rows, campaigns, and report types use no points. Funnel.io's pricing page calls Flexpoints part of your contract, not a usage meter: the bill changes only when you buy more.
- No overage charges. At full capacity Funnel.io may stop you adding accounts or destinations until you free points or buy more. Funnel.io shows the impact of a change before you commit.
2 things decide whether your bill holds:
- The shape of your stack. Count connectors, accounts, and destinations, not data. 20 new client ad accounts add 100 points; 1 warehouse adds 300.
- The plan gate. BigQuery, Power BI, Tableau, Salesforce, custom connectors, and 2-hour exports start on Business. 1 new destination can move you up a plan and a bundle at the same time.
What happens when you add a connector or destination?
A new connector costs 50 points plus 5 for each account on it; a new destination costs 150 or 300. Points come in bundles of 100, so the bill moves in steps, not per item.
Take 1 year of an ordinary marketing stack. The stack and the months are illustrative; the rates are Funnel.io's.
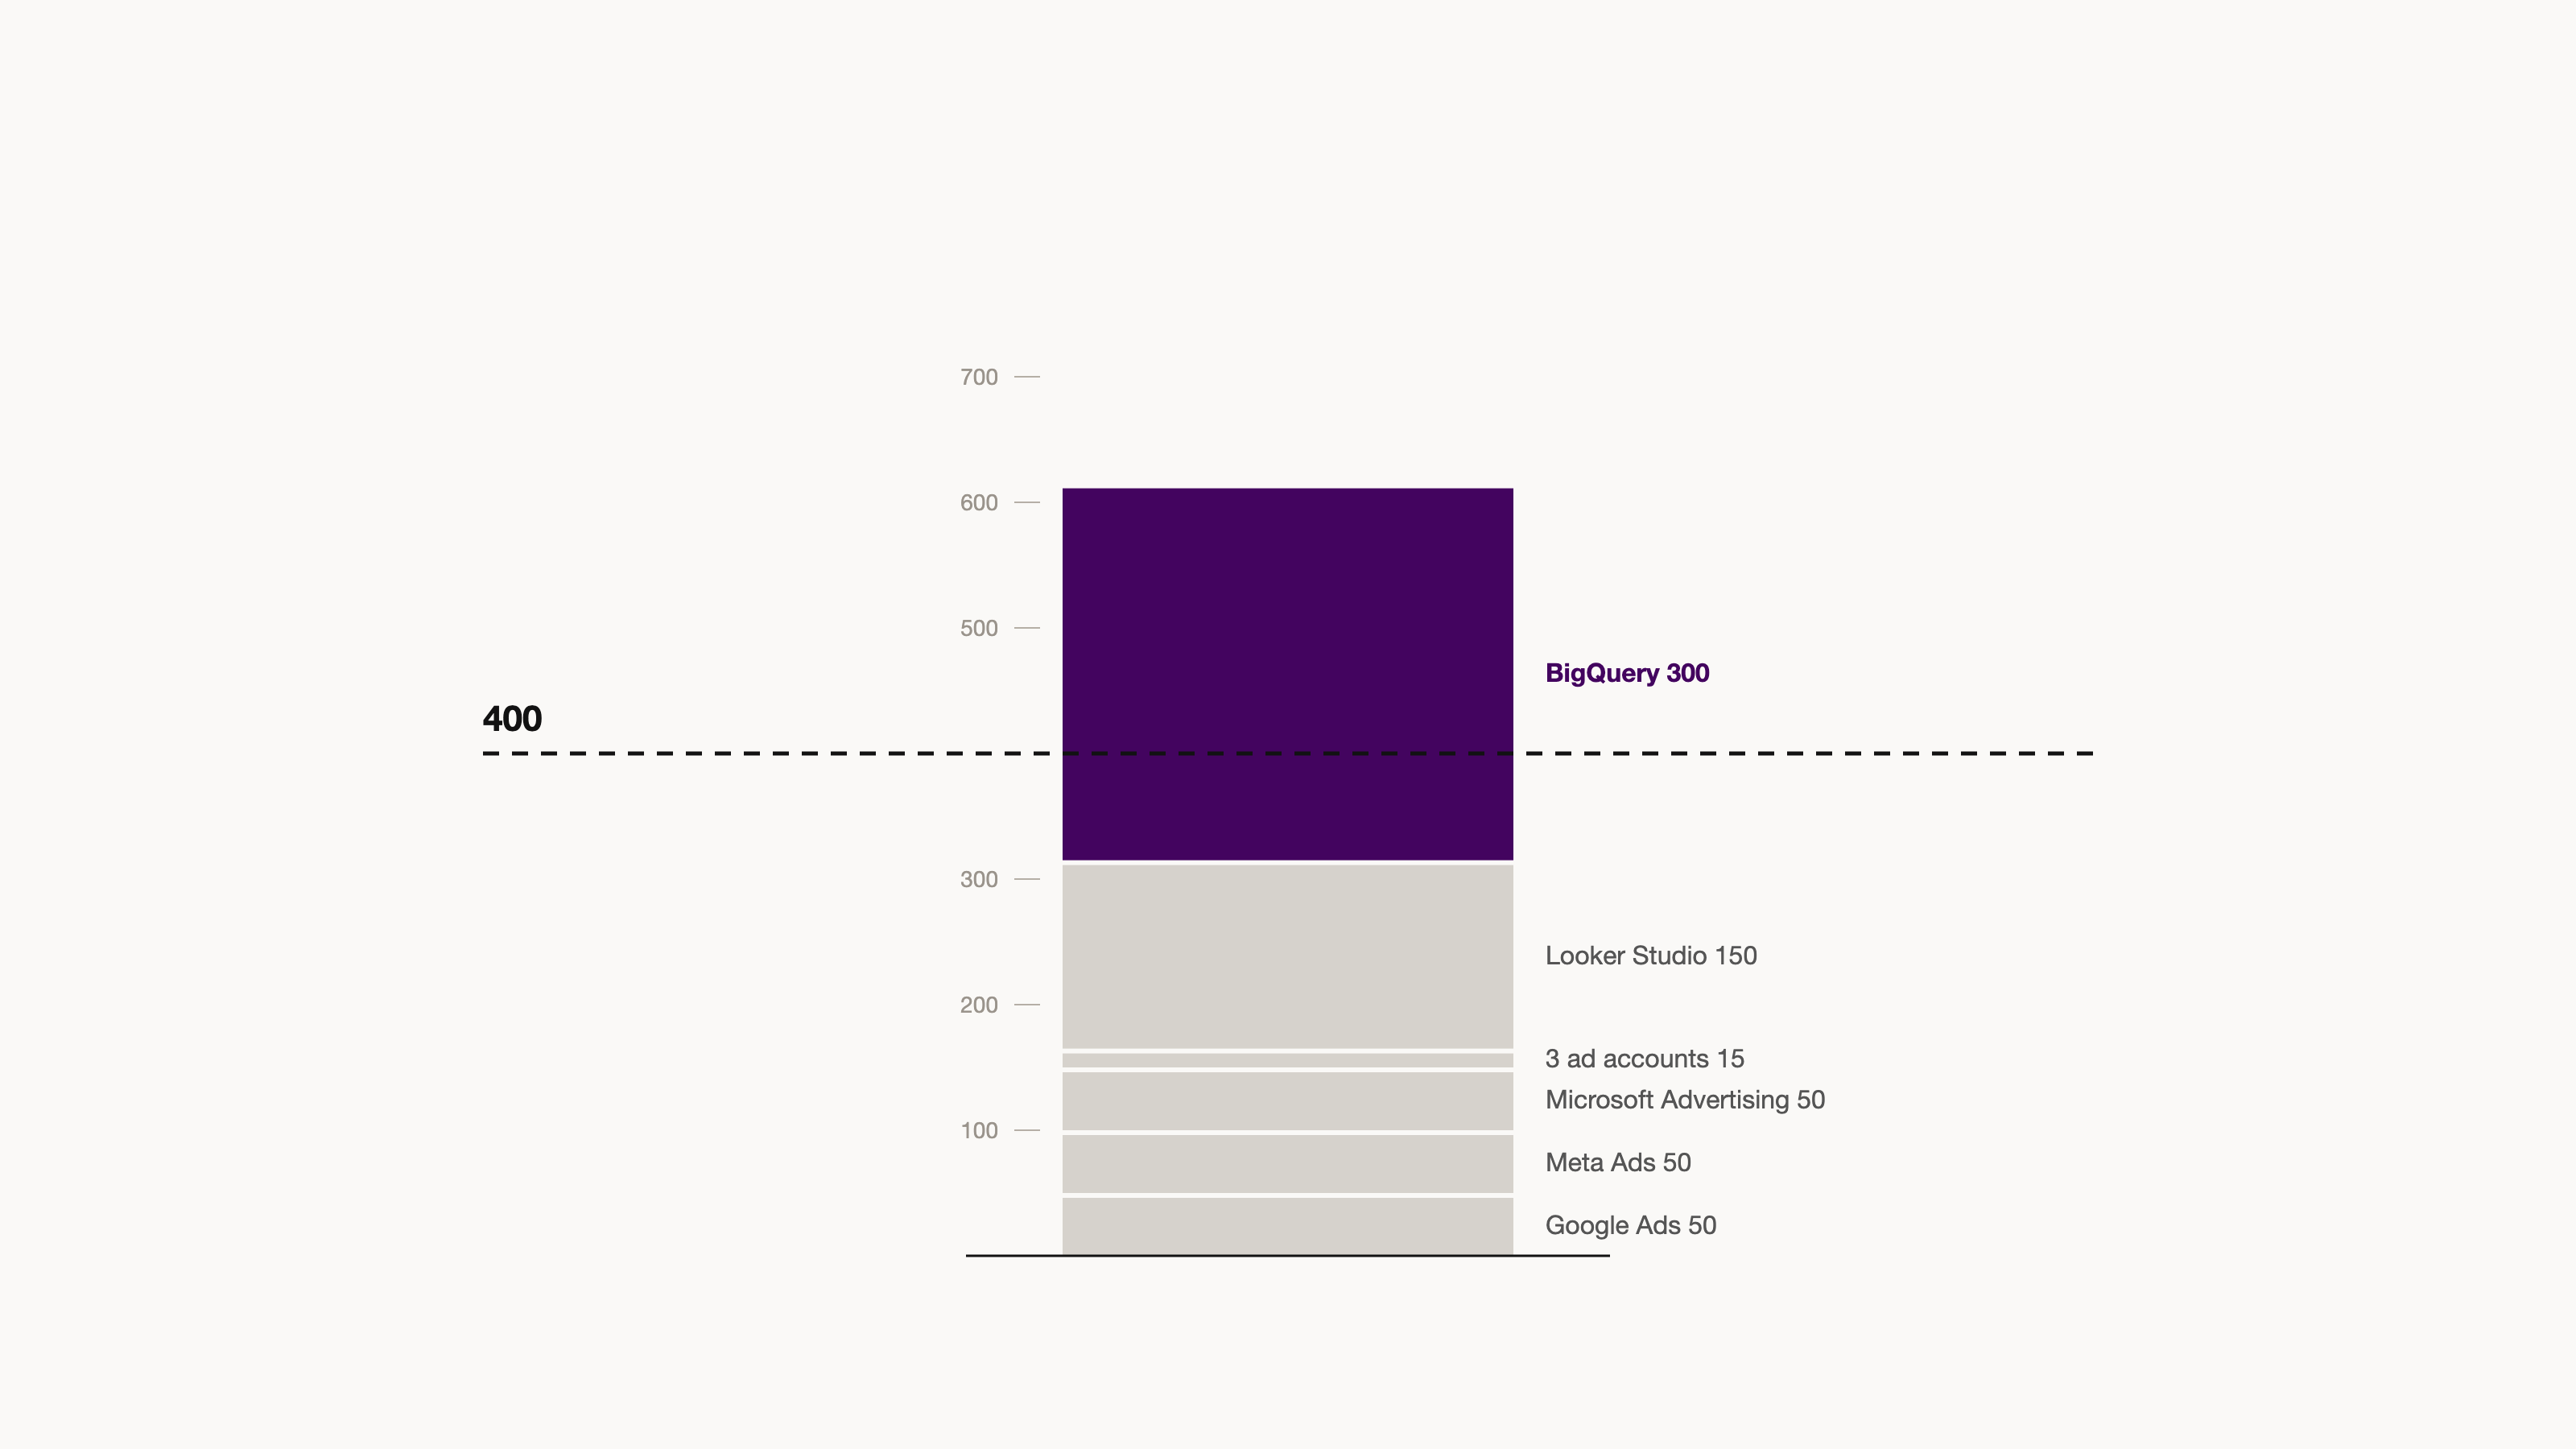
- January. Google Ads, Meta Ads, and Microsoft Advertising, 1 ad account each, into Looker Studio: 315 points. The team pays for the 400-point minimum on Starter.
- March. A 2nd brand adds 3 ad accounts on the same connectors: 15 points.
- May. TikTok Ads for the 2nd brand: 55 points, connector plus account.
- July. Finance wants the data in BigQuery: 300 points. BigQuery export starts on Business, so the plan moves too.
- September. Pinterest Ads: 55 points.
- November. A Power BI report for the board: 150 points.
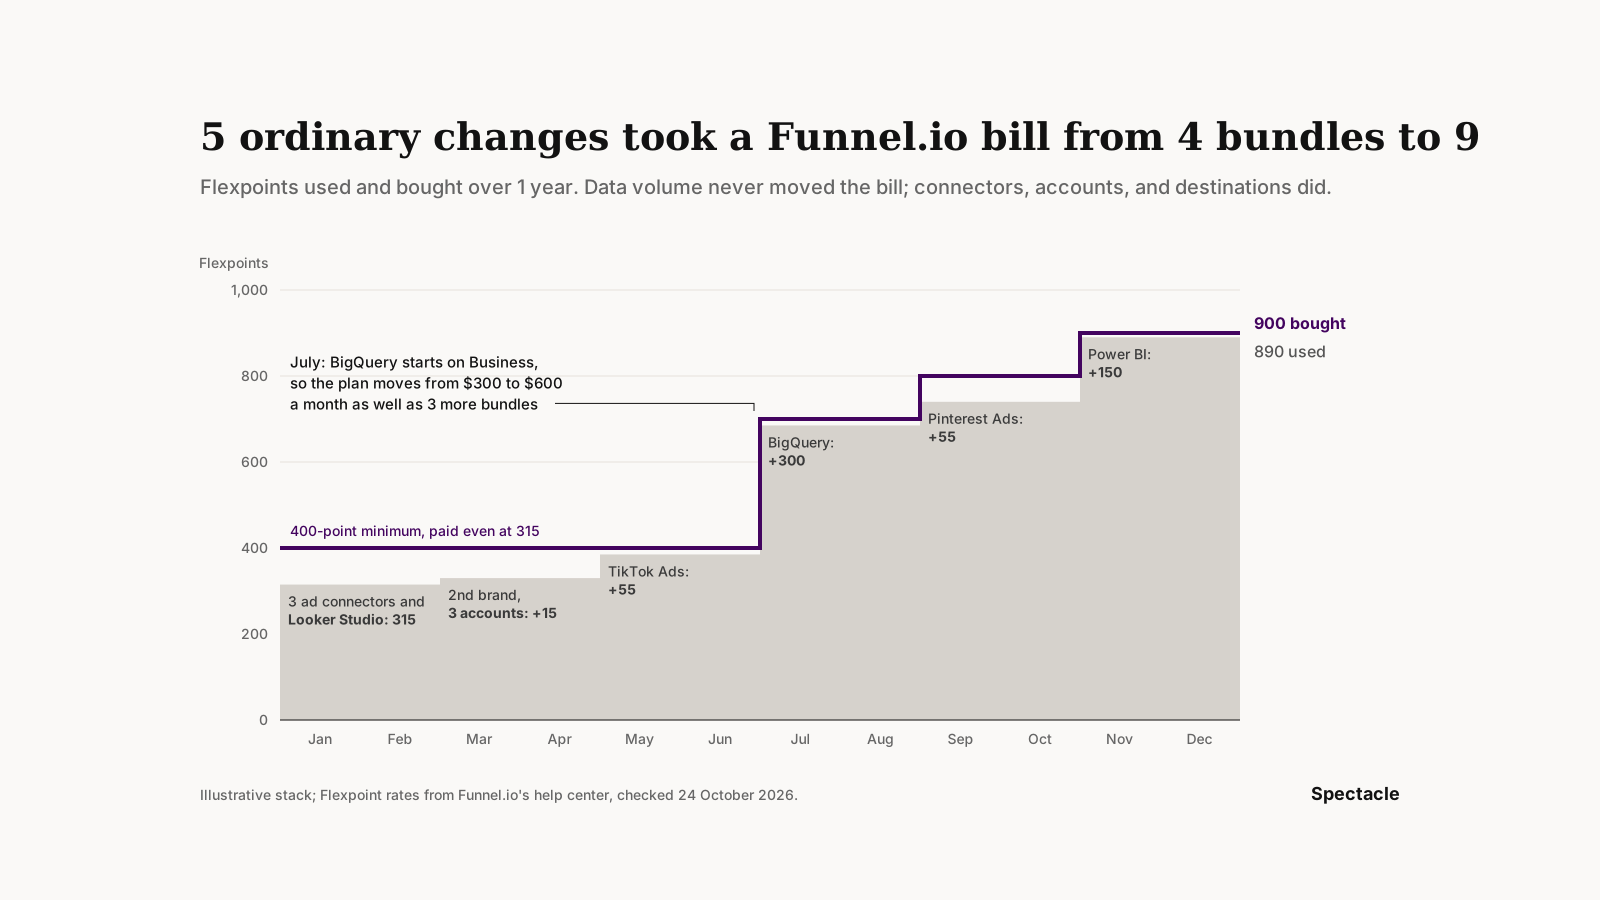
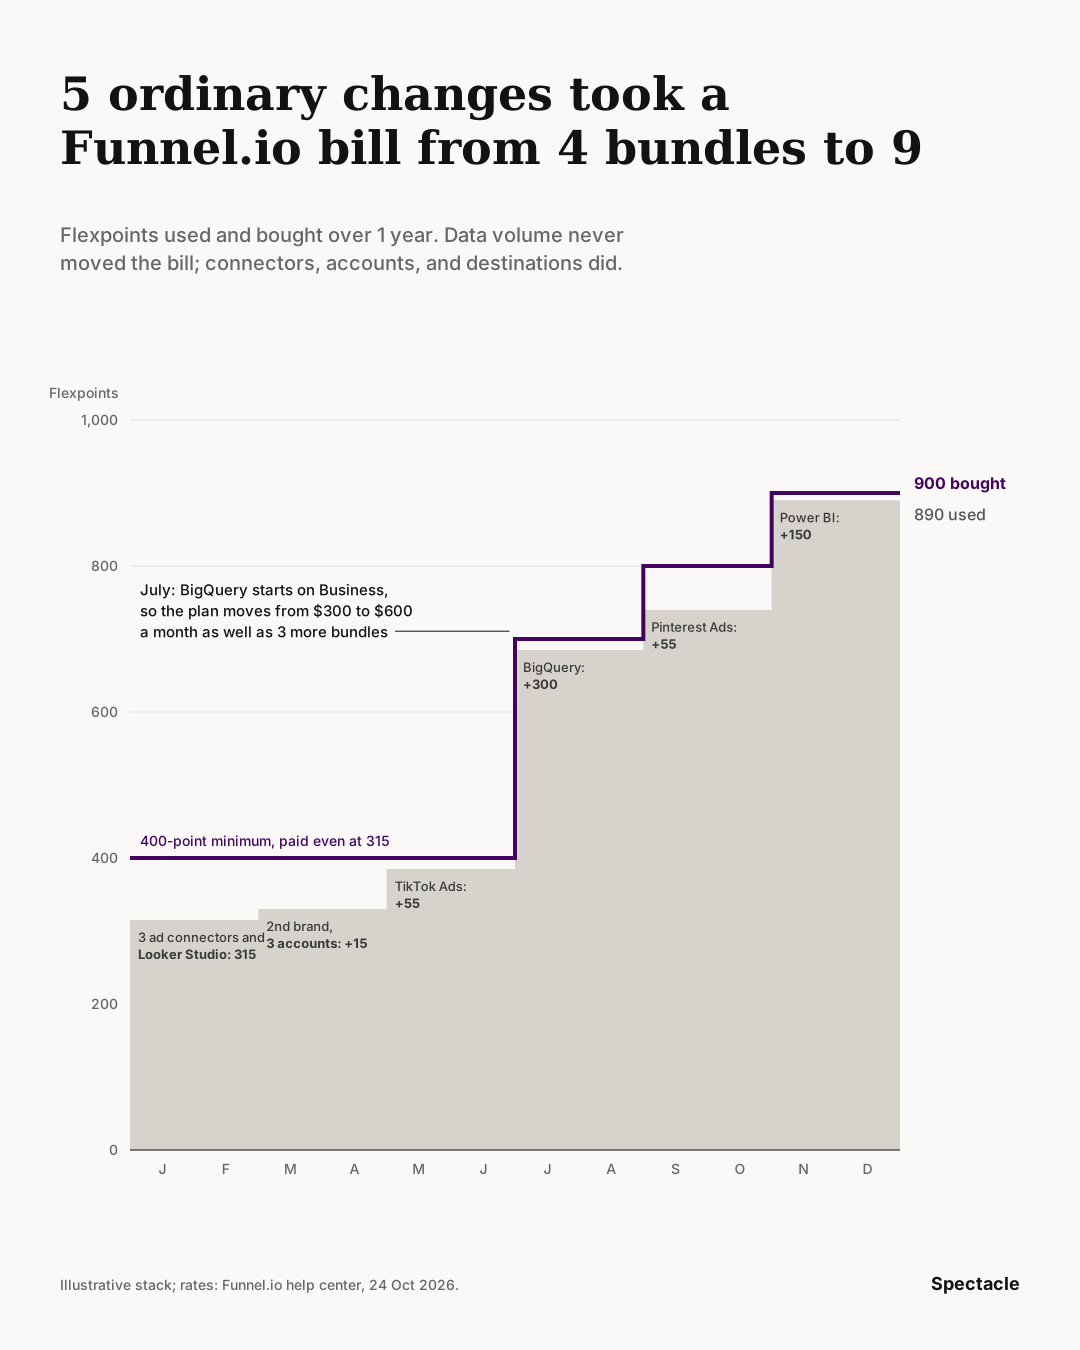
Flexpoints follow the shape of the stack, not the data. 5 ordinary changes took the stack from 315 points to 890 and capacity from 4 bundles of 100 to 9. The plan moved from Starter to Business, whose starting price is 2 times Starter's.
To forecast your bill, list every connector, account, and destination you plan to run in the next 12 months. Multiply by the rates above and round up to the next 100. Then ask Funnel.io for the bundle price on your plan, in writing.
Is Flexpoints pricing harder to predict than flat-rate tools?
It is easier to predict than a metered bill and harder than a plan with published prices. Flexpoints ignore data volume, so a stack that stands still keeps its bill. They move with every connector, account, and destination, and the price of the next bundle isn't public.
Each tool's pricing page, checked 24 October 2026, shows what drives its bill:
| Tool | You pay for | Published entry price | What 1 more source does |
|---|---|---|---|
| Funnel.io | A plan plus Flexpoints for connectors, accounts, and destinations | Starter from $300 a month, Business from $600, billed annually | 50 points for a connector, 5 for an account; bundles of 100 at an unpublished price |
| Supermetrics | A plan with limits on destinations, sources, accounts, and users | Starter $55 a month ($44 billed yearly), Growth $222 ($177) | Nothing within the 3 or 6 sources; beyond that an add-on or the next plan |
| Whatagraph | Source credits: 1 per connected account | Max from €699 a month, billed annually, with 50 credits | 1 credit; extra credits up to the next plan, price not published |
| Improvado | A plan by rows processed; all connectors included | MCP Only $100 a month for 2 million rows a year; Starter from $20,000 a year for 20 million | Nothing per connector; more rows can mean the next plan |
| Fivetran | Monthly active rows per connection | No plan prices; page examples from $15.88 a month for GA4 | Its own rows, plus a $5 base charge on standard connections with up to 1 million monthly active rows |
| Twilio Segment | Monthly tracked users | Team from $120 a month for 10,000 users | Nothing; every 1,000 extra users costs $10 to $12 |
| Spectacle | A plan by monthly ad spend | Scale €349 a month, Enterprise on request | Nothing up to the plan limit: 8 ad accounts on Scale, unlimited on Enterprise |
Fivetran and Segment bill on volume, so a busy month costs more. Funnel.io never does that, and its app shows the Flexpoint cost of a change before you commit. Supermetrics and Spectacle publish both the plan and what it covers, so you can price a year from the pricing page alone.
Flexpoints carry 3 forecasting risks: the unpublished bundle price, the plan gate for a warehouse or Salesforce, and account growth if you run many brands or clients. 20 new accounts add 100 points. If your stack will change more than 2 times a year, get the bundle price for your plan in writing and price each planned change in whole bundles before you sign.
Funnel.io vs Supermetrics, Whatagraph, and the rest
Funnel.io vs Supermetrics for data aggregation and custom connectors
Supermetrics prices by plan limits. Starter covers 1 destination, 3 data sources, 3 accounts per source, and 1 user for $55 a month, or $44 billed yearly. Growth covers 6 sources, 7 accounts per source, and 2 users for $222, or $177. BigQuery, Snowflake, data transformations, and custom data imports need Enterprise.
Funnel.io puts warehouses on Business and builds custom connectors on request from Business up. For enterprise data hub management, its edge is the model in the middle: custom dimensions, metrics, and rules set once and sent to every destination. Supermetrics' edge is price at small scale: 3 sources into Looker Studio cost $44 a month billed yearly, against Funnel.io's $300 starting price.
Is Funnel.io worth the switching cost if you already use Supermetrics? Count first. If you send up to 6 sources to 1 destination, Supermetrics Growth at $177 a month billed yearly is hard to beat. Funnel.io starts paying off when you need a warehouse, more than 2 destinations, or 1 data model shared across teams. Add the hours to rebuild reports and mappings to the price.
Funnel.io vs Whatagraph for agency client reporting at scale
Whatagraph charges 1 source credit per connected account, so 5 clients on Facebook Ads use 5 credits. Max starts from €699 a month, billed annually, with 50 credits; you buy extra credits up to the next plan threshold, then upgrade through a sales call. Funnel.io's agency plans start from $300 a month, billed annually, with 1 client portal, or $600 with unlimited portals and optional custom branding. Every client ad account uses 5 Flexpoints.
Both bills grow per client account; neither publishes the price of the next unit. Whatagraph's product is the client report; BigQuery transfer is an add-on on its custom-priced Prime plan, not on Max. Funnel.io's product is the data model behind the report, sent to Looker Studio, Power BI, or a warehouse. Ask both what 10 more client accounts cost before you sign.
Improvado, Fivetran, and Segment
- Improvado includes every connector and destination and prices by rows processed: Starter from $20,000 a year for 20 million rows, Growth from $50,000. An MCP Only plan costs $100 a month for 2 million rows a year. The full plans suit enterprise teams with that budget.
- Fivetran is a general pipeline into your own warehouse, billed on monthly active rows per connection, plus a $5 base charge on standard connections with 1 to 1 million monthly active rows. It needs a data team to model the rows into reports.
- Twilio Segment collects events from your site and app and routes them to other tools, billed on monthly tracked users rather than on sources or destinations.
| Situation | Use | Check it against |
|---|---|---|
| Up to 6 sources into Looker Studio or Google Sheets | Supermetrics Starter or Growth | The 3 or 6 source limit and the accounts per source |
| Many sources into a warehouse or BI tool, 1 shared data model | Funnel.io Business or Improvado | The price of a 100-point bundle, or the rows per year |
| Client reporting across many agency accounts | Whatagraph, or Funnel.io's agency plans | The cost of 10 more client accounts: 10 credits or 50 points |
| Your own pipelines into a warehouse | Fivetran | Monthly active rows per connection, plus $5 per standard connection up to 1 million rows |
| Site and app events into many tools | Twilio Segment | Monthly tracked users above 10,000 on Team |
| Which campaigns create revenue in your CRM | Spectacle | Your plan's ad spend and ad account limits |
What do G2 and Capterra reviewers say about Funnel.io?
Funnel.io scores 4.5 out of 5 from 291 reviews on G2 and 4.7 from 19 on Capterra, where the reviews shown date from 2020 to 2023. 5 themes repeat:
- Connectors. Ease of Use and Integrations are G2's top pros, tagged 5 times each; Connectors Quantity gets 2 tags, and Limited Connectors appears 2 times as a con. The gaps: some platform dimensions aren't available, so 1 reviewer uploads batches by hand and puts native coverage at 70 to 80% of their needs.
- Data reliability. Reviewers call it stable. The caveats: numbers that differ from the source platform when its API limits what Funnel.io can pull, fields the API doesn't expose, and slow performance on large data volumes, which G2 tags 2 times.
- Learning curve. Data source setup and field mapping take time to learn. Learning Curve is G2's most-tagged con, with 3 mentions.
- Price. Reviewers call it expensive but worth the time it saves. On G2, costs rise once you need certain integrations, and 1 reviewer wanted Tableau or Snowflake in the base price.
- Support. Praised on both sites, with Capterra reviewers citing quick responses and a good knowledge base; 1 G2 reviewer says Funnel.io stopped providing support after a model change.
A hub can only be as complete as each platform's API.
Where Funnel.io wins, and the question it doesn't answer
Funnel.io wins when the job is moving marketing data. More than 500 connectors on Business, 46 destinations, exports every 2 hours, and no charge for rows make it a strong pipe into BigQuery, Power BI, or Looker Studio. If your data team models everything in a warehouse, that pipe is worth paying for, and Spectacle doesn't replace it.
The question a data hub doesn't answer on its own is which campaign created the deal. The hub collects conversions as each ad platform reports them. In Funnel Measure, the platform attribution model shows them without deduplication, so the totals often exceed real sales (help center). Meta says it was Meta, Google says it was Google, and both get counted.
| Method | What it tells you | What it needs |
|---|---|---|
| Platform-reported conversions, in any data hub | What each platform claims, overlaps included | Nothing extra |
| Marketing mix modeling, in Funnel Measure | Modeled lift per channel, from aggregated daily data | At least 365 days of data; priced by ad spend or on request |
| Data-driven multi-touch, in Funnel Measure | Credit per touchpoint, assigned by a machine-learning model | Tracked touchpoints (clicks and site visits); priced by ad spend or on request |
| Journey tracking joined to the CRM, in Spectacle | Every touchpoint of each buyer, matched to the deal and its revenue | A tracking snippet, a CRM connection, and about 30 minutes |
The rows answer different questions, so they don't cancel each other out. A model estimates what a channel adds; a journey shows what each buyer did before the deal. Spectacle keeps every touchpoint with no lookback cap and shows first touch, last touch, linear, and U-shaped side by side, so you can check each model against the others.
What changes when you measure revenue, not platform claims
Platform numbers and revenue part ways in these 3 situations. The first is plain arithmetic; the other 2 come from anonymized Spectacle accounts.
€49 a month is €588 a year, and Meta sees €49 of it
A subscription at €49 a month is worth €588 in its first year. Meta counts conversions for 7 days after the click, so its report, and every data hub that pulls it, holds the first €49 and none of the other €539.

Action: judge acquisition campaigns on cohort revenue, such as all March sign-ups over 12 months, not on the first payment.
A €29,000 purchase that GA4 logged as direct
A long-cycle purchase of €29,000 arrived in GA4 as direct traffic. Spectacle traced the journey behind it over about 90 days. Direct is a measurement gap, not a channel.
Action: before you cut a campaign for not converting, check how many direct deals started with it.
€878 against €128 per CRM contact
A property developer compared channels on cost per CRM contact: €878 on 1 channel, €128 on another. The platform reports showed leads from both; only the CRM join showed what each contact cost.
Action: move budget away from the expensive channel and retarget the visitors who used the price calculator, the strongest buying signal in property.
How to set up Spectacle next to your data hub in 5 steps
Most teams are done in about 30 minutes. Keep Funnel.io, or any other hub, running while you do this: the point is to compare.
- Clean the CRM. Every deal needs an amount, a stage, and a contact with an email, and contacts should link to their company. Spectacle can only credit revenue the CRM records.
- Connect your ad accounts. Google Ads and Microsoft Advertising are tagged automatically and keep your own UTM scheme; Meta and TikTok take the URL parameters Spectacle gives you. Spend comes in per campaign, ad group, and ad.
- Install tracking. Add the JavaScript snippet or the Google Tag Manager template, and identify people when they fill in a form, so their earlier anonymous visits join their journey. Then pick the moment a visitor becomes a lead, such as a demo request.
- Connect the CRM and payments. HubSpot, Pipedrive, ActiveCampaign, Zoho, Monday.com, or Odoo on Scale; Salesforce or Dynamics 365 on Enterprise; Stripe for payments and refunds. Your CRM history is imported when setup is done.
- Compare 1 month side by side. Put revenue per campaign from Spectacle next to the platform conversions in your hub, and book a 30-minute review with whoever owns the budget.
Spectacle vs Funnel.io: first-year cost and time to first insight
The 2 tools do different jobs, so compare them on the job you need done. Prices as each pricing page shows them by default, checked 24 October 2026: Funnel.io in US dollars, Spectacle in euros.
| Funnel.io | Spectacle | |
|---|---|---|
| The job | Collect, transform, and send marketing data to BI tools and warehouses | Track each buyer's journey and tie it to CRM deals and revenue |
| The price is set by | Plan plus Flexpoints: 50 per connector, 5 per account, 150 or 300 per destination | Plan, by monthly ad spend: up to $100K on Scale, custom on Enterprise |
| Published prices | Starter from $300 a month, Business from $600, billed annually; extra bundles priced per plan, not published | Scale €349 a month, or €319 billed annually; Enterprise priced on request |
| First-year cost at entry | From $3,600 on Starter or $7,200 on Business, before extra bundles | €3,828 on Scale, billed annually |
| Measurement | Funnel Measure add-on on Business and Enterprise: an estimated $2,250 a month, billed annually, at $500K to $1M monthly ad spend; Advanced Measurement is custom-priced | 4 models side by side on every plan; company-level attribution and cohort revenue on Scale |
| A new connector or ad account | 50 or 5 points, sometimes a new bundle | Included up to the plan limit: 8 ad accounts and 2 CRMs on Scale, unlimited on Enterprise |
| A new destination | 150 or 300 points, warehouses from Business; conversion uploads to ad platforms 50 points plus 5 per account, on every plan | Conversion syncs to ad platforms and audience syncs to Meta, Google, LinkedIn, and OpenAI, included on Scale |
| Data volume | Not billed | Capped by plan: 500,000 sessions a month on Scale, custom on Enterprise |
| Time to first insight | 30-day free trial; exports daily on Starter, every 2 hours on Business | Setup in about 30 minutes; 14-day free trial; CRM history imported at setup |
| Where it wins | More than 500 connectors and 46 destinations, including Power BI, Tableau, and BigQuery | Revenue per campaign from the CRM, every touchpoint kept, no lookback cap |
Spectacle costs €349 a month on Scale, or €319 billed annually, with a 14-day free trial and no credit card (pricing). The price doesn't change with campaigns or reports; you move up a plan when you pass its ad spend, ad account, CRM, or session limit.
Funnel.io Flexpoints pricing FAQ
What is a Flexpoint in Funnel.io?
A Flexpoint is Funnel.io's unit of subscription capacity. Connectors use 50, platform accounts 5, visualization destinations 150, and data warehouse destinations 300; data volume uses none. Every plan starts at 400 points, and you add capacity in bundles of 100.
How much does Funnel.io cost?
Starter starts from $300 a month and Business from $600 a month, billed annually; Enterprise is quoted. Every plan requires at least 400 points. Extra 100-point bundles cost a different amount on each plan; Funnel.io doesn't publish the price, and you buy them through sales or in the app. The Data Hub has a 30-day free trial with no card.
What happens to my Flexpoints when I add a connector or destination?
A new connector uses 50 points plus 5 for each account on it, and a destination uses 150, or 300 for a data warehouse. When the total passes your capacity, you buy the next bundle of 100. Until you do, Funnel.io may block new accounts and destinations; it doesn't bill an overage.
Is Funnel.io worth the switching cost if we already use Supermetrics?
If you send up to 6 sources to 1 destination, Supermetrics Growth costs $177 a month billed yearly and is hard to beat on price. Funnel.io earns its price when you need more than 2 destinations or 1 data model shared across teams. A warehouse needs Funnel.io's Business plan, from $600 a month, or Supermetrics' Enterprise plan. Add the hours to rebuild reports and mappings to the comparison.
Is Funnel.io or Whatagraph better for agency client reporting at scale?
Both bills grow per client account. Whatagraph charges 1 source credit per account, from €699 a month, billed annually, for 50 credits. Funnel.io charges 5 points per account plus 50 per connector, from $300 a month, billed annually, on its agency plans. Whatagraph sells the client report, Funnel.io the data model behind it, so ask both what 10 more client accounts cost.
Does Funnel.io do attribution?
The Data Hub collects conversions as each platform reports them. Funnel Measure, an add-on on Business and Enterprise, shows those numbers next to its own marketing mix modeling and data-driven multi-touch models. It adds incrementality testing and is priced by ad spend or on request. To tie each buyer's touchpoints to a CRM deal, you need journey tracking joined to the CRM, which Spectacle does from €349 a month.
What do G2 and Capterra reviewers say about Funnel.io?
Funnel.io scores 4.5 out of 5 from 291 reviews on G2 and 4.7 from 19 on Capterra. Reviewers praise ease of use, integrations, and support, and name the learning curve, missing platform fields, and price as the main drawbacks.
Revenue per campaign from €349 a month, set up in about 30 minutes
Spectacle tracks every touchpoint, joins it to the deal in your CRM, and shows revenue per campaign in 4 models side by side. Scale costs €349 a month, and most teams are set up in about 30 minutes. Keep your data hub for the warehouse; use Spectacle for the revenue question.
Start a free 14-day trial or book a demo.
Related reading
- Fivetran review: do you need a data warehouse to see what's working?
- Dreamdata review: features, pros, cons, and alternatives
- HockeyStack review: features, pros, cons, and alternatives
- B2B revenue attribution software: the buyer's guide
- Multi-touch attribution: what it is, 4 models, and how to set it up
- Platform overview
- Cross-channel funnels
- Pricing
- Core concepts
- Cohort-aligned revenue reporting
Sources, checked 24 October 2026
- Funnel.io: pricing, agency pricing, Understanding Flexpoints, connectors, platform accounts, and data sources, organize your data, attribution models in Funnel Measure, Funnel Measure, HubSpot connector, Salesforce connector, company overview
- Alternatives: Supermetrics, Whatagraph, Improvado, Fivetran, Twilio Segment
- Reviews: G2, G2 pros and cons, Capterra
- Spectacle: pricing
Latest insights
General News
February 27, 2026
Vincent Gaemers